
Bitcoin Power Law Explained
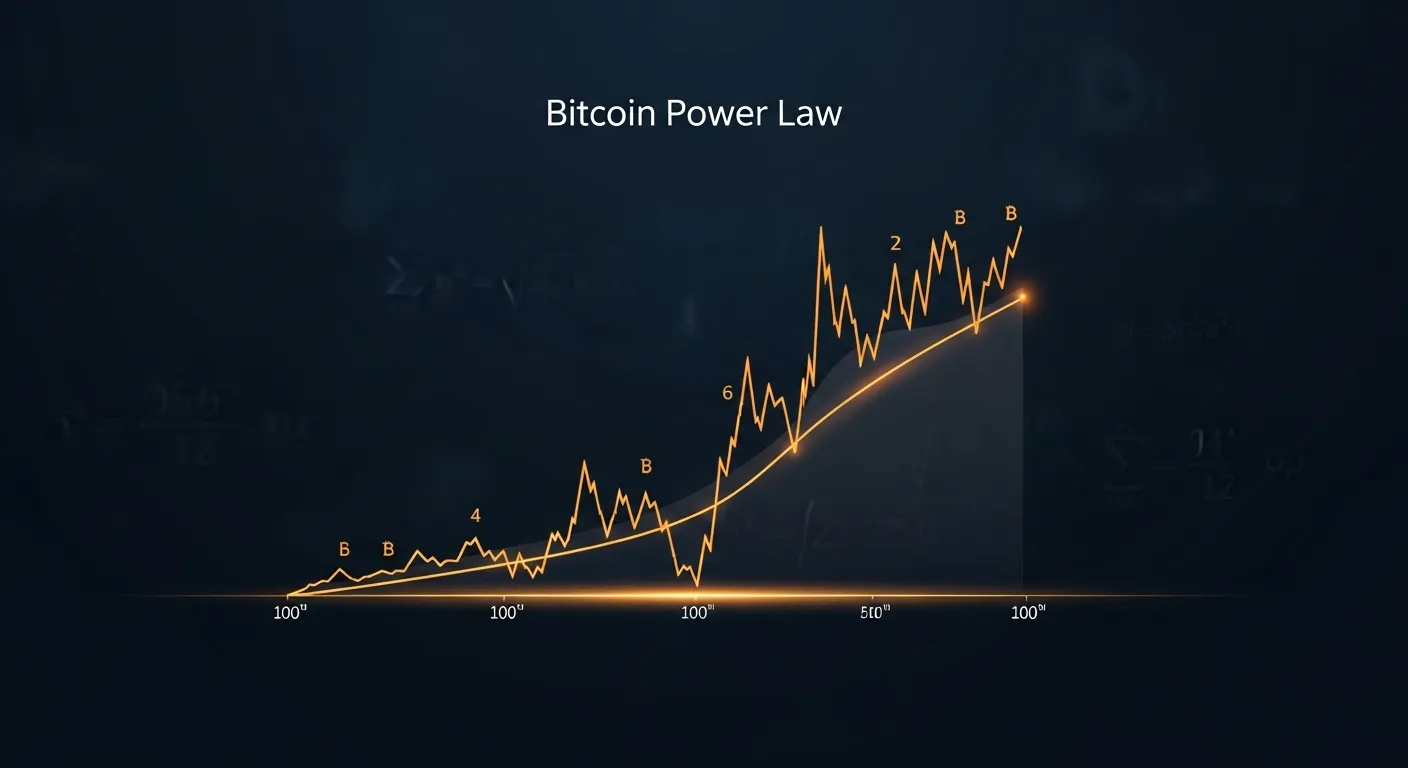
Every Bitcoin investor has felt it: the gut-wrenching panic during a 40% crash, or the euphoric certainty that "this time it's going to infinity." Human emotions are powerful — but they are terrible forecasting tools. The Power Law model offers a radically different approach: let the math speak.
What Is a Power Law?
A power law is a mathematical relationship where one quantity varies as a power of another. In plain English: instead of growing at a fixed percentage each year (exponential), the growth rate itself slows down over time — but never stops.
The formula:
Price = A × Time^n
Where:
- A is a constant (starting scale)
- Time is measured in days since Bitcoin's genesis block (January 3, 2009)
- n is the power law exponent (approximately 5.8 for Bitcoin)
When you plot Bitcoin's entire price history on a log-log chart (logarithmic on both axes), something remarkable happens: the data points form an almost perfectly straight line. This is the hallmark of a power law relationship.
Who Discovered Bitcoin's Power Law?
The Bitcoin Power Law was first described by Giovanni Santostasi, a physicist and neuroscientist, who observed that Bitcoin's price follows a power law relationship with time — similar to phenomena in physics, biology, and network science.
Unlike exponential models that predict unsustainable parabolic growth ("Bitcoin to $100 million by next Tuesday"), the Power Law model shows that:
- Growth is decelerating — each doubling takes longer than the last
- Growth never stops — it just slows down gradually
- The pattern has held for 15+ years — through bubbles, crashes, bans, and halvings
Why Log-Log Charts Matter
Most people look at Bitcoin's price on a linear chart and see chaos — insane spikes followed by devastating crashes. It looks random and unpredictable.
But when you plot the same data on a log-log chart, the chaos disappears. What emerges is a remarkably straight corridor:
- Upper bound: The maximum prices during bubble peaks
- Center line: The Power Law regression — the "fair value"
- Lower bound: The minimum prices during bear market bottoms
In over 15 years of data, Bitcoin has never broken below the lower power law support line. Every crash, no matter how severe, has stayed within the predicted corridor.
Power Law vs. Other Models
Power Law vs. Stock-to-Flow (S2F)
The Stock-to-Flow model, created by PlanB, predicts Bitcoin's price based on scarcity — specifically the ratio of existing supply to new production. After each halving, the model predicts a massive price increase.
| Feature | Power Law | Stock-to-Flow |
|---|---|---|
| Basis | Time-price relationship | Scarcity ratio |
| Growth type | Decelerating | Step-function jumps |
| Halving impact | Gradual, already priced in | Primary driver of price |
| Long-term behavior | Smooth deceleration | Exponential jumps |
| R² (fit to data) | ~0.95 | ~0.94 |
| Criticism | May underestimate short-term moves | Ignores demand side entirely |
Key difference: S2F predicts sudden, halving-driven price jumps. The Power Law predicts smooth, time-based growth. In reality, both forces likely contribute — but the Power Law has been more consistent over full market cycles.
Power Law vs. Exponential Models
Exponential growth means growing at a constant percentage forever — 50% per year, every year, forever. This is mathematically impossible over long timeframes because it would eventually require more money than exists in the world.
The Power Law model is fundamentally more sustainable because the growth rate itself decreases over time:
| Year Range | Approximate Annual Growth |
|---|---|
| 2011–2015 | ~200% per year |
| 2015–2019 | ~80% per year |
| 2019–2023 | ~50% per year |
| 2023–2026 | ~35% per year |
| 2030+ | ~20–25% per year (projected) |
This deceleration is exactly what the Power Law predicts — and exactly what we observe.
The Science Behind It: Why Does Bitcoin Follow a Power Law?
Power laws aren't unique to Bitcoin. They appear throughout nature and human systems:
- City sizes follow a power law (Zipf's law)
- Earthquake magnitudes follow a power law (Gutenberg-Richter law)
- Internet network growth follows a power law (Metcalfe's law variant)
- Word frequency in any language follows a power law
Bitcoin's power law behavior likely emerges from its nature as a network technology with:
- Network effects: Each new user makes the network more valuable for all existing users
- Adoption curves: Technology adoption follows S-curves, which approximate power laws during the growth phase
- Reflexive feedback loops: Price increases attract attention, which drives adoption, which increases price — but with diminishing intensity over time
- Fixed supply schedule: The predictable, pre-programmed supply curve creates a stable foundation for demand-driven price discovery
What the Power Law Predicts for the Future
Using the Power Law model with approximately 35% annualized growth (decelerating over time):
| Year | Projected BTC Price | Confidence |
|---|---|---|
| 2027 | $130,000 – $180,000 | Higher |
| 2030 | $400,000 – $600,000 | Medium |
| 2035 | $1,000,000 – $2,000,000 | Lower |
| 2040 | $3,000,000 – $5,000,000 | Speculative |
Important: These are model projections, not certainties. The corridor widens as we look further into the future, reflecting increasing uncertainty.
Why Emotions Fail Where Math Succeeds
The Problem with "Gut Feelings"
Human brains evolved to survive on the savannah, not to forecast asset prices. We suffer from well-documented cognitive biases:
- Recency bias: We overweight recent events. After a crash, we think Bitcoin is dead. After a rally, we think it will go up forever.
- Loss aversion: Losses feel roughly 2x more painful than equivalent gains feel good. This causes panic selling at the worst possible time.
- Herding behavior: We follow the crowd. When everyone is buying (bubble peak), we buy. When everyone is selling (bottom), we sell.
- Anchoring: We fixate on specific numbers. "I'll buy when it drops back to $X" — even if the model says $X is already far below fair value.
How the Power Law Model Helps
The Power Law doesn't care about feelings. It looks at 15+ years of data and says: "Here is where Bitcoin should be, plus or minus a corridor."
Practical applications:
- Is Bitcoin overvalued? Check if the price is near the upper bound of the power law corridor. If yes, consider reducing exposure.
- Is Bitcoin undervalued? Check if the price is near the lower bound. If yes, historically this has been an excellent time to accumulate.
- When will I reach financial freedom? Use the center line projection to estimate your retirement timeline — which is exactly what the WenMoon calculator does.
Limitations of the Power Law Model
No model is perfect. Here are the honest limitations:
1. Past Performance ≠ Future Results
The fact that Bitcoin has followed a power law for 15 years doesn't guarantee it will continue forever. External shocks (government bans, competing technology, catastrophic bugs) could break the pattern.
2. The Corridor Is Wide
The difference between the upper and lower bounds is substantial — often 10x or more. Saying "Bitcoin will be between $200,000 and $2,000,000 in 2032" is technically correct but not very actionable for short-term decisions.
3. Timing Is Still Uncertain
The model tells you the general trajectory, not the exact price on a specific date. It's a compass, not a GPS.
4. Black Swan Events
The model cannot account for truly unprecedented events — things that have never happened before. A global ban on Bitcoin, a fundamental protocol vulnerability, or the emergence of a superior alternative could invalidate the model.
How WenMoon Uses the Power Law
The WenMoon Bitcoin Retirement Calculator uses the Power Law model as one of four prediction models to estimate your "Moon Date" — the date when your Bitcoin portfolio will reach financial freedom.
Here's how it works:
- You enter your current Bitcoin holdings, monthly investment, and desired monthly expenses
- The calculator applies the 4% rule: Your portfolio needs to be 25x your annual expenses
- The Power Law model projects Bitcoin's price forward at ~35% annualized growth (decelerating)
- Your portfolio grows through both price appreciation and monthly DCA contributions
- The result: A projected date when your portfolio crosses the financial freedom threshold
The key insight: by combining the Power Law's mathematical rigor with your personal financial data, you get a more grounded estimate than any gut feeling could provide.
The Bottom Line
The Bitcoin Power Law model isn't a crystal ball. It won't tell you tomorrow's price. But it does something far more valuable: it reveals the long-term trajectory hidden beneath the daily noise of euphoria and panic.
The math suggests that Bitcoin is following a remarkably predictable growth pattern — one that has held through Mt. Gox, China bans, COVID crashes, FTX collapse, and everything in between. Growth is decelerating, as the model predicts, but it isn't stopping.
For long-term investors planning their financial future, the Power Law offers something emotions never can: a framework grounded in data, not feelings.
👉 Calculate your personal Bitcoin retirement date — takes just 30 seconds! (free)
This article is for educational and informational purposes only and does not constitute financial advice. All prediction models are speculative and can be completely wrong. Bitcoin is extremely volatile. Never invest more than you can afford to lose.
Related Articles

Bitcoin Savings Plan: DCA Strategy
Learn how you can build long-term wealth with a Bitcoin savings plan through regular investments.

Bitcoin Retirement Planning: A Step-by-Step Guide
A practical, step-by-step guide to planning your retirement with Bitcoin. From setting your target number to building a savings plan and managing risks — everything you need to get started.

Bitcoin in 2030: Price Predictions
How much could a single Bitcoin be worth by 2030? We analyze four leading prediction models — Power Law, Stock-to-Flow, Rainbow Chart, and Conservative — to explore realistic price scenarios.